Jupyter Notebooks
While dashboard apps are perfect for setting up ilumr and running routine experiments, Jupyter Notebooks provide more flexibility and control over ilumr. These Notebooks provide a combination of rich text elements, executable Python code, and inline plot displays. This makes them perfect for creating multi-step experiments, running interactive lab scripts, and developing pulse sequences.
For more information on Jupyter Notebooks, the official documentation can be found here.
Programming in Python
ilumr is fully programmable using Python 3, which can be run in a Python Notebook.
Pulse sequences are constructed and experiments are run using our matipo Python library (see the matipo Usage section).
Other third party python libraries can be used for data processing, plotting, interactive widgets and more. Some useful libraries, which come preinstalled, are:
- numpy: https://numpy.org/doc/stable/
Perform calculations on arrays of data efficiently. Also includes many useful algorithms, e.g. FFT and matrix manipulation.
- scipy: https://docs.scipy.org/doc/scipy/
An extensive library of scientific data processing methods.
- matplotlib: https://matplotlib.org/stable/users/index
Easy to use plotting library with an API that will be familiar to MATLAB users.
- bokeh: https://docs.bokeh.org/en/latest/
Create Beautiful interactive visualizations.
- panel: https://panel.holoviz.org/
Build dashboards for experiments with a library of widgets.
- ipyvolume: https://ipyvolume.readthedocs.io/en/latest/
Simple 3D volume data visualization.
Example Notebooks
The best way to familiarise yourself with ilumr’s Jupyter Notebooks is to work your way through some example Notebooks. On your ilumr, you can find example Notebooks in the user/notebooks/example notebooks directory. You can also download example Notebooks from our ilumr Resources GitHub Repository and our ilumr Courseware GitHub Repository. Our courseware is a great example of how you can use these Notebooks to combine diagrams, text, and graphical user interfaces into a single Jupyter Notebook.
Running a Jupyter Notebook
Notebooks have the .ipynb extension and can be opened by double clicking in the file browser.
To run a single cell: Click the play button (1.) at the top of the Notebook or click a code cell and use the shift+enter shortcut. Once a cell has been executed, the next cell will be automatically selected. The blue bar (2.) shows the currently selected cell. Pressing the play button repeatedly will execute the cells in order.
To run all cells: Click Run > Run All Cells (3.) in the top left menu bar.
Sometimes code blocks are hidden from view (4.). You can expand these code blocks by clicking the three dots.
Jupyter Notebook
Note
Having many Notebooks open at once can use a lot of system memory and slow it down, if you notice issues you can use the running sidebar as shown below to shutdown the running kernels of unused Notebooks and free up system resources.
Programmatic vs Graphical User Interface (GUI)
While working through the example Notebooks, you will notice that there are two main ways to run magnetic resonance experiments in the Notebooks: programmatically or through GUIs.
To Run a Programmatic Experiment:
Input and edit parameters within the code blocks.
Execute each cell in order to run the experiment. The pulse sequence begins when the code block including “data = await seq.run()” is executed.
Print statements are used to show the experiments progress.
Execute data processing and plotting cells to display plots.
Enter file name then execute code block that includes “np.save(f’{SAVE_DIR}/{SAVE_NAME}’, y)” and “seq.savepar(f’{SAVE_DIR}/{SAVE_NAME}.yaml’)” to save data.
To Run a GUI based Experiment:
Execute code blocks to load the GUI.
Set parameters using user input boxes.
Press green Run button to begin experiment.
The experiment progress is shown using a progress bar.
Plots are generated automatically in the GUI.
Enter a file name and press the blue Save button to save data.
Creating a Notebook
To create a new Notebook:
Click the + button in the file browser to open the Launcher tab.
Click the Python 3 button under the Notebook heading.
Create New Notebook
To copy a Notebook:
Select an existing notebook and right-click-> duplicate or right-click->copy and right-click->paste.
Rename the copy.
Open Notebook for editing.
Creating Experiments
Each method for creating and running experiments has its advantages. When developing novel experiments and pulse sequences, it is often more convenient to implement the experiment programmatically. Once you have fully developed the experiment and selected your key plots types, you can then package the experiment into a GUI. A combination of programmatic experiments and GUI based experiments can be created in a single Notebook.
Programmatic Experiments
The matipo library allows you to run programmatic MRI experiments in a Jupyter Notebook. You can view the API reference for this library here: Running a Pulse Sequence
Experiment data can then be processed using numpy and plotted using matplotlib.
Programmatic Notebook Experiment
GUI Experiments
The ilumr experiment library allows you to create your own custom dashboard-style graphical user interfaces (GUIs) in Jupyter notebooks. This experiment library handles pulse sequence execution, data plotting, input widgets, plot layout, and state preservation.
You can view the API reference for this library here: Experiment Building Tools
GUI Notebook Experiment
The ilumr-courseware repository is a great place to see more examples of how the experiment library can be used to create different GUIs for MRI experiments.
Creating Text
The text sections of the Notebook are great for writing educational content, creating lab tasks, noting down your MRI experiment setup, and documenting your code.
To add a text cell, press the small + symbol (1) on the Notebook’s top panel and then select Markdown in the drop down menu (2).
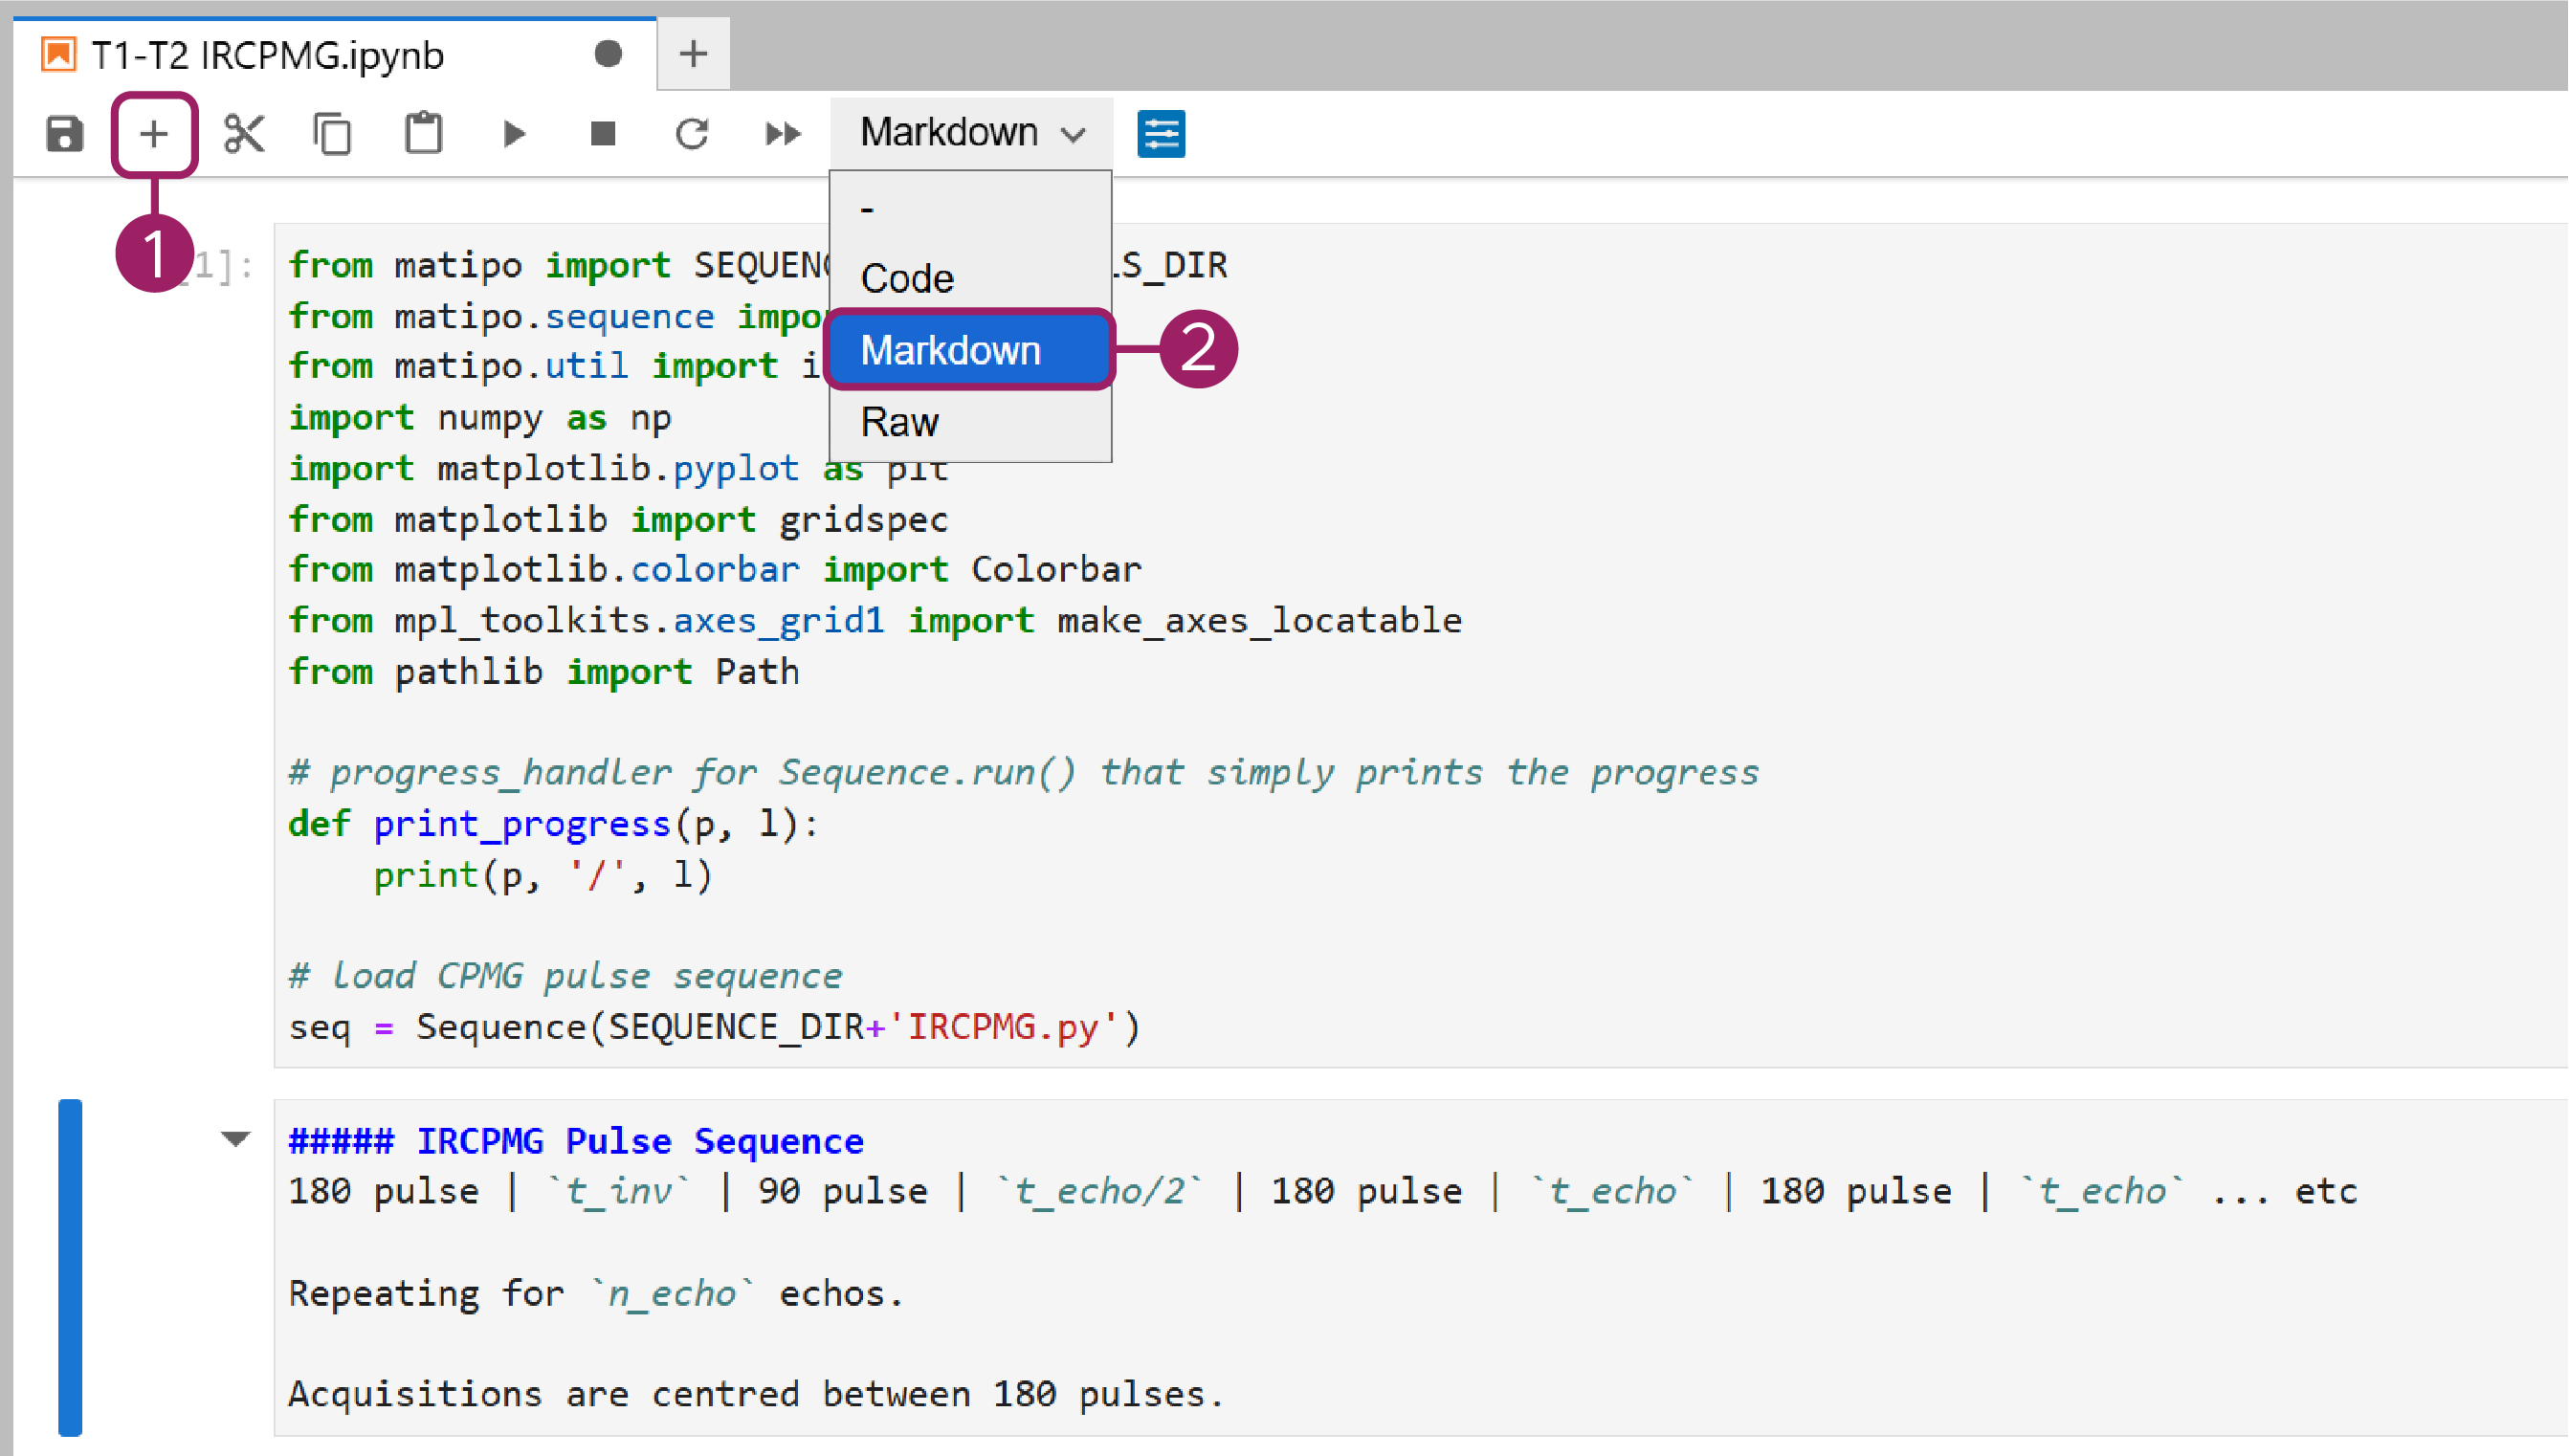
Adding Markdown Cells
You can use Markdown syntax and HTML styling to add text and images to the cell. Then, run the cell (shift+enter) to produce the formatted text output.
If you’re new to markdown and HTML, the following online guides may be useful: Markdown Cheat Sheet and Structuring Content with HTML
Below is an example of combining markdown syntax and HTML styling.
Example Code:
<figure style="float: right;">
<img src="Images/CapCircuit.png" width="300" style="display: block;">
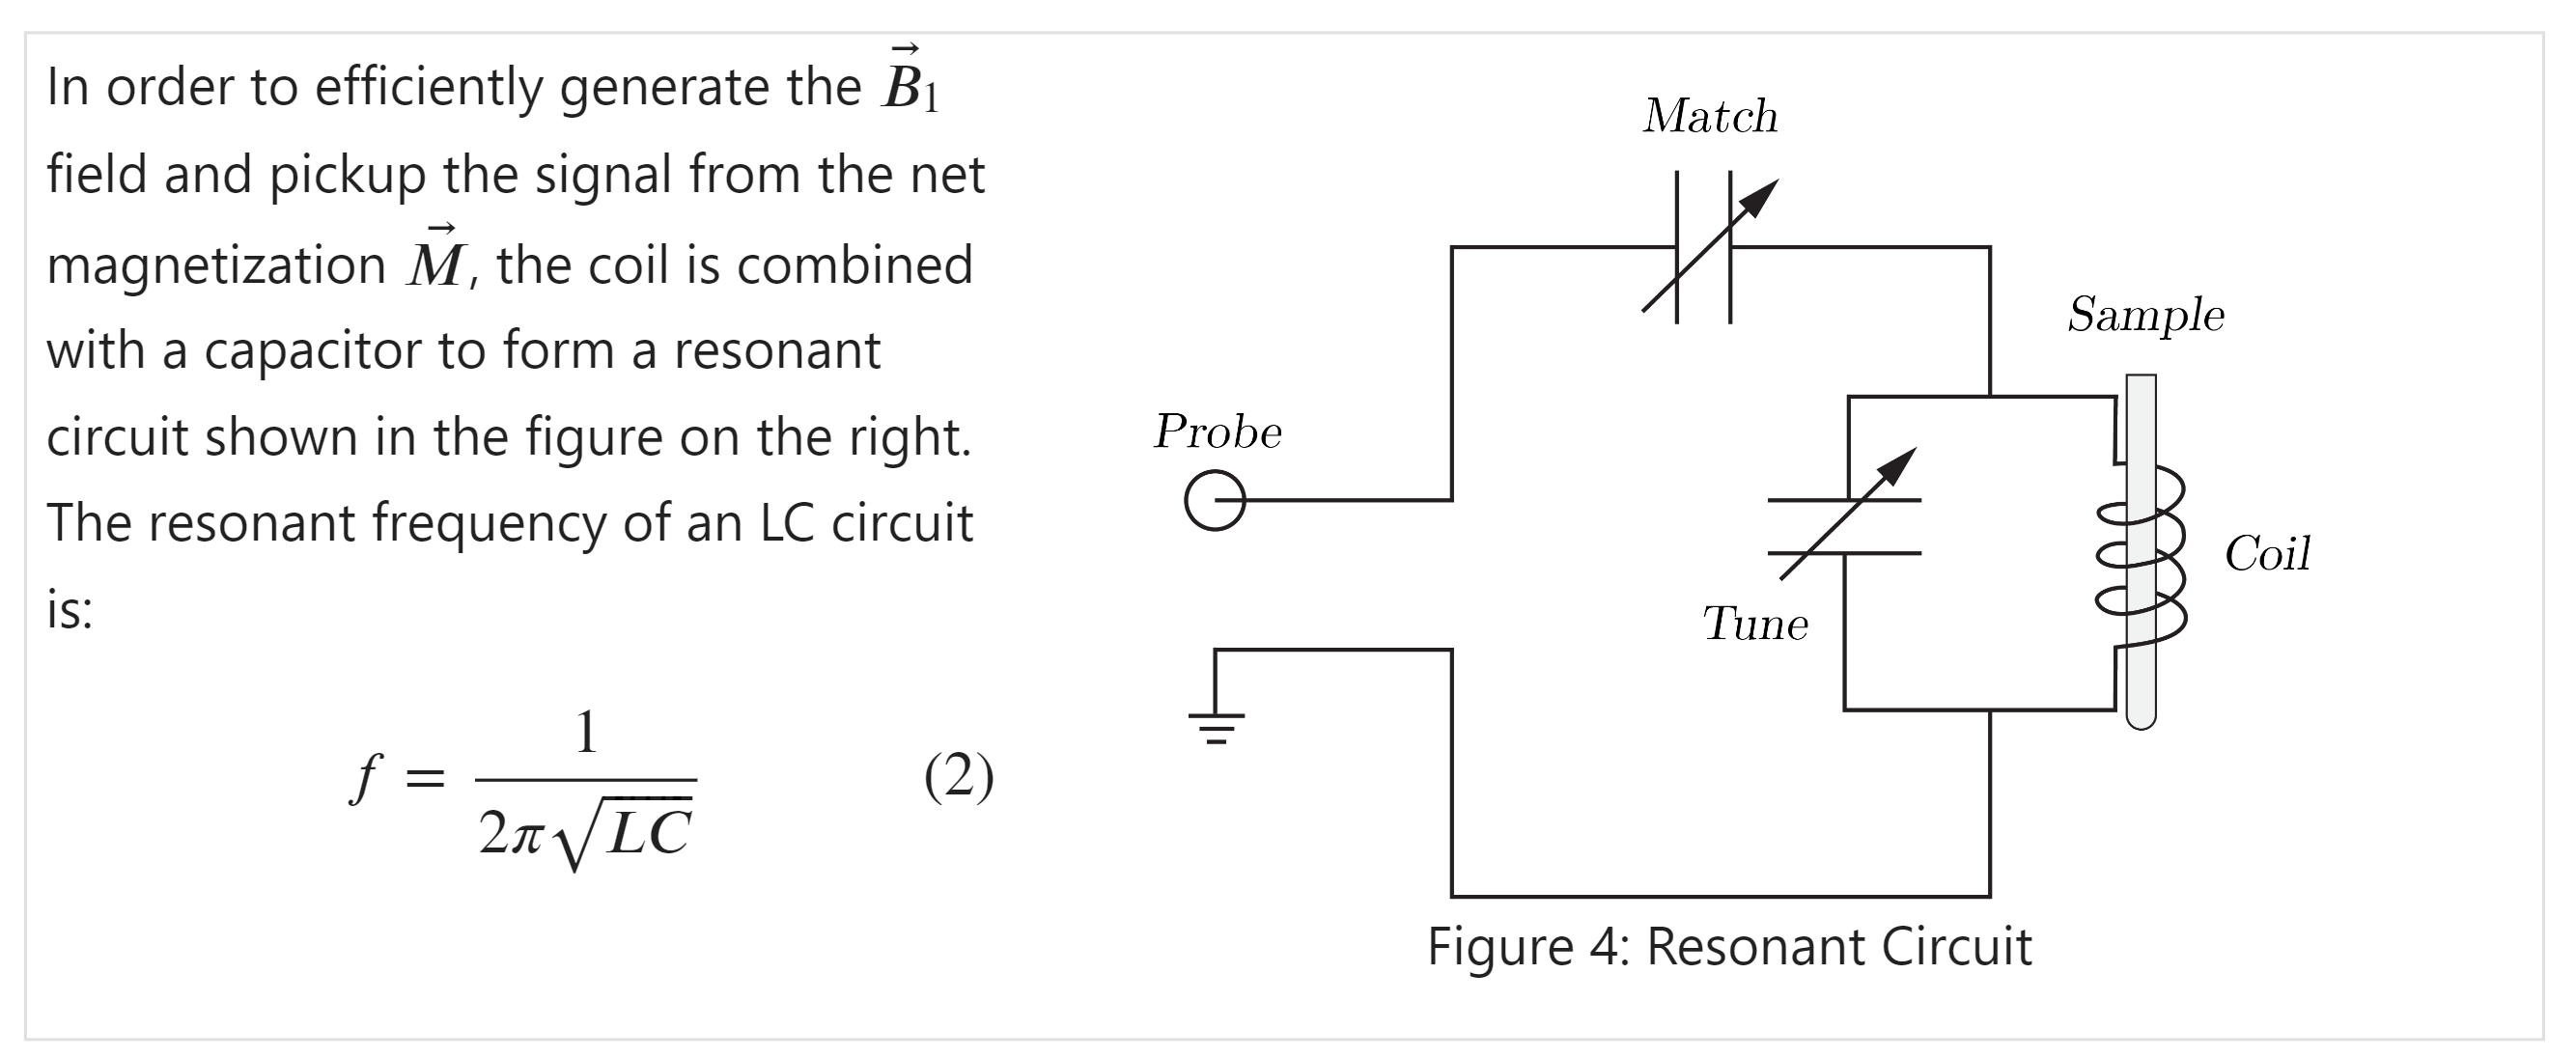
<center><figcaption style="width: 300px;">Figure 4: Resonant Circuit</figcaption></center>
</figure>
In order to efficiently generate the $vec B_1$ field and pickup the signal from the net magnetization $vec M$, the coil is combined with a capacitor to form a resonant circuit shown in the figure on the right. The resonant frequency of an LC circuit is:
$$f = \frac{1}{2\pi\sqrt{LC}} \tag{2}$$
Output:
Rich Text Output